
Ok, now that you are completely confused, I can explain phasors in a sentence. All phasors contain a magnitude and a reference angle to some established signal.
That is all well and good, but how do we use them in MATHS? In real analysis there is no unique solution to vector division, and if we need to divide a voltage vector by a resistance vector, we are stuck. Luckily, Complex analysis (inclusion of sqrt(-1) in our terms as i or j) allows for complex division, and now we proceed to apply Ohm's Law to our hearts content.
Now for applications, take for instance the two sinusoids found below.

The blue curve has an RMS voltage of .707 V, whereas the green curve has an RMS voltage of .530 V. There is also some appreciable difference in their phase, as the green peaks consistently lag behind the blue peaks. If we wanted to quantify the difference in their phase we could measure their period, (about 63 units here) and the horizontal distance between two points of interest, such as their peaks or when they cross the x-axis. By inspection, their peak values appear to be off by 13 units. It is now possible to measure the phase difference between these two waveforms. In the unit of degrees, the phase difference can be defined as:

Which in this case indicates that our green waveform lags the blue waveform by 74.3 degrees.
These measurements can also be performed on an oscilloscope (o-scope), which is a device used to measure voltage as a function of time. Any student with a background in mathematics has spent a good amount of time looking at graphs, and those skills are easily applicable to use of an o-scope.
Most of the time an o-scope looks like this:
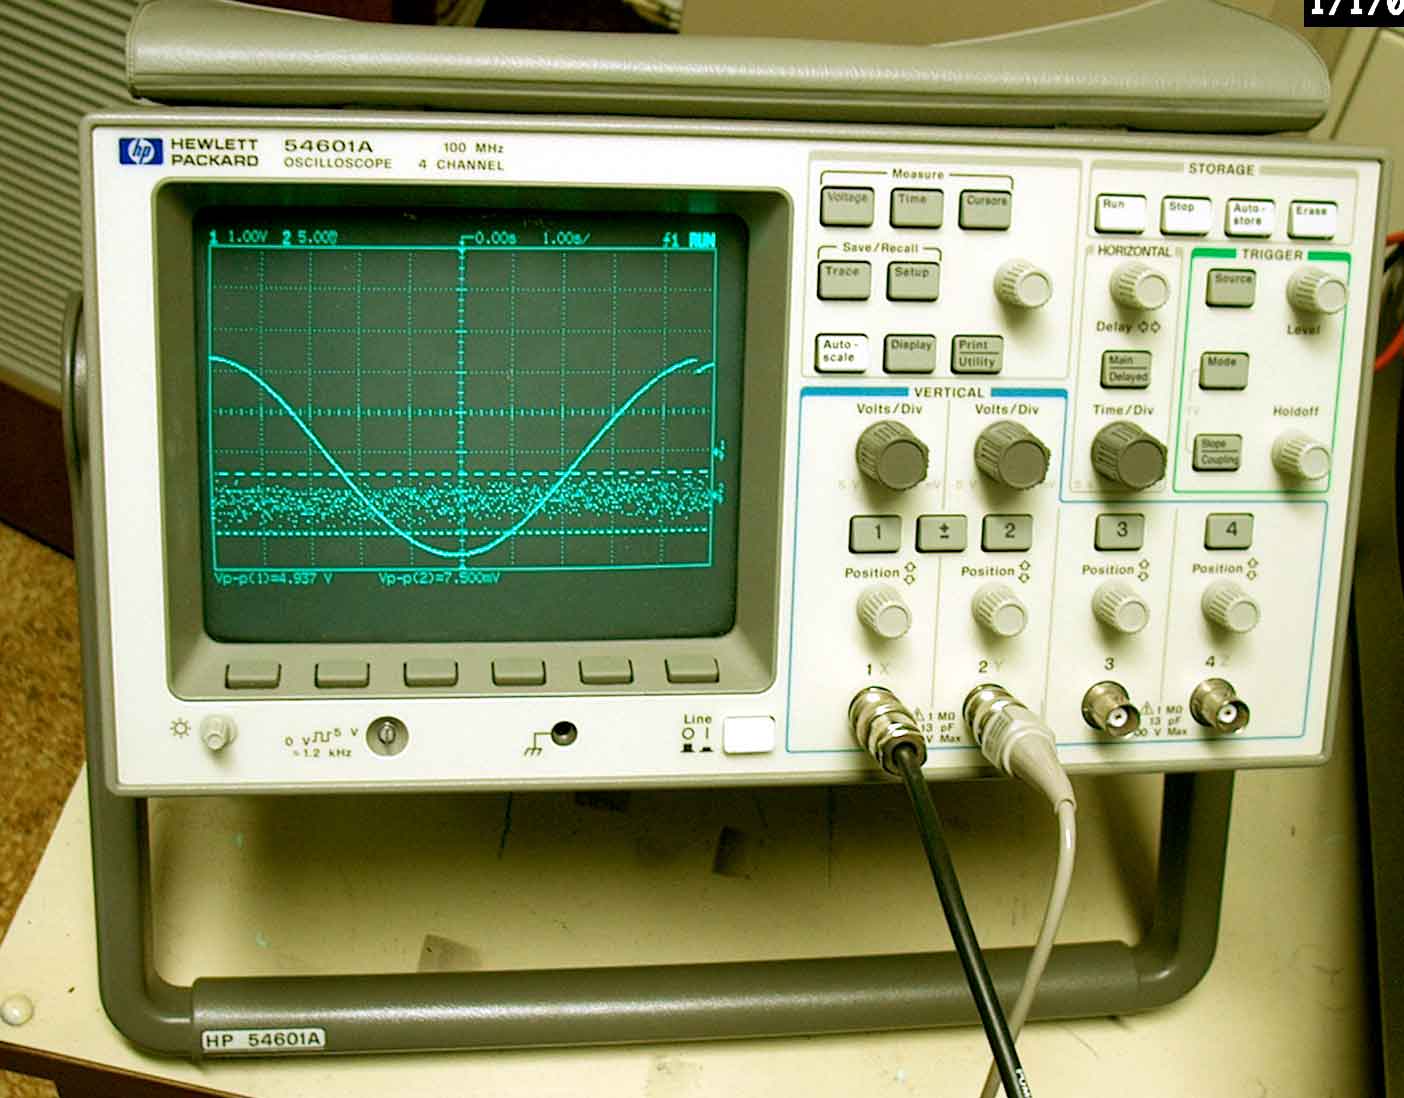 [picture credit to http://www.caraudio.com/forums]
The o-scope pictured is a digital storage o-scope, and it has the benefit of being able to store transient signals on the display for analysis. Another type of o-scope is the analog scope, which has its own benefits. A more detailed discussion of scopes and their characteristics can be found here.
The focus of this lab will be to familiarize students with the operation of an o-scope and to analyze a simple AC circuit.
Equipment:
Function Generator
O-scope
Scope Probes
Variable Resistance Box
Capacitor (100 nF)
Step 1:
Set the function generator to output a waveform with 10 V peak-peak at 1kHz.
What is the RMS value of this waveform?
3.356 V
Step 2:
Measure the Voltage of the function generator using a Digital Multimeter.
What is the measurement?
3.3 V
Is it the same as your answer from step 1?
no, the voltage recorded by the digital multimeter is likely in error. The meter chosen is a standard cheap toolbox model and probably does not handle high frequency measurements very well.
Step 3:
Calculate the impedance of the 100nF capacitor at 1kHz? (show equation)

Step 4:
Assemble the following circuit and connect the o-scope probe such that it measures the voltage across the capacitor.

Special consideration must be used when measuring components using an o-scope. Many scopes have what is called a 'common ground' meaning the alligator clips attached to them are all connected to each other and the earth ground. If you connect a ground in the wrong place in your circuit you can short components out of the circuit, and furthermore you can damage your probes and scope. That being said, always connect your scope probes to the same node as the ground for your function generator in order to take proper measurements.
Step 5:
Measure the voltage across the capacitor.
8.2 V peak-peak
Step 6:
record the voltage using the DMM, do the results match?
2.78V
the predicted RMS voltage, based on the peak to peak value is 2.90 V, so it is close.
Step 7:
Set up channel 1 of the o-scope to measure the function generator and have channel 2 measure the capacitor voltage. Now measure the phase difference between the two.
approx: 30.19 degrees
Step 8:
Which signal leads and which lags?
Ch1 is leading, thus the capacitor voltage lags the source voltage.
Step 9:
Sketch the display and indicate how your determined the phase difference.

Step 10:
Increase the function generator frequency to 10kHz:
Measure the peak-peak voltage on the capacitor at the new frequency.
1.68V
Step 11:
Record the RMS voltage according to the DMM
429mV
step 12:
Find the phase difference between the source signal and the capacitor voltage.
79.776 degrees
Step 13:
Now try switching the resistance box to 10kOhms and observe the difference:
Vcap = 1.69V
Vcap,rms = .518
phase difference = 77.839 degrees
Step 14:
now toggle the resistance box until the capacitor voltage is 4V peak-peak.
R = 4kOhms
Vcap,rms = 1.223
phase difference = 66.16 degrees
Analysis:
Sweep the function generator across the range of available frequencies, record your observations.
The voltage across the capacitor is higher when the frequency is low, and lower when the frequency is high. This correlates with what is described as a lowpass filter. Adjusting the frequency lower makes the phase difference between the two signals approach 0 degrees, and adjusting it higher makes the phase difference approach 90 degrees.
No comments:
Post a Comment