Install LaTeX?

Monday, June 4, 2012

Introduction to Freemat part 2


This post is a continuation of Introduction to Freemat :

Freemat is an excellent graphing tool, and with a little bit of electrical theory under our belts we can use it to predict the state of a circuit element at some point in the future. As a consequence of Maxwell's Laws, the solution to the state of a circuit which contains resistors, inductors and capacitors is takes the form of a differential equation.
Frequently, the voltage may resemble one of the following graphs if the circuit is not continuously driven by some input voltage.


In this case, it is clear that the voltage is oscillating and decaying at the same time. This appears to be an exponential with both real and imaginary parts. (if that is unclear please review Euler's Formula) and we can model it very efficiently in Freemat.

The script that outputs those three waveforms is as follows:
========================================================
%ploting complex exponentials
pptau = 100 %data points per time constant
real = 1; % the real coefficient
imag = 3; % the complex coefficient
tc = 5; % how many time constants to plot
s=(1:pptau*tc)/pptau; %a normalised axis
for i0 = 1:pptau*tc
e1(i0) = exp(-(real+imag*j)*i0/pptau);
e2(i0) = exp(-(real+imag*1.5*j)*i0/pptau);
e3(i0) = exp(-(real+imag*2*j)*i0/pptau);
end
plot(s,e1)
hold on
plot(s,e2)
plot(s,e3)
hold off

=========================================================

Assignment 1 :
 A)
Use Freemat to model the output of two exponential decay circuits with time constants of 100ms and 200ms. Which one reaches steady state sooner?

The original script can be modified in some simple ways to achieve this result.

I will allow you to figure that part out for yourself, but the results can be seen here.


it is clear that the blue signal (time constant of 100ms) decays to the steady state condition first.

B)
The circuit is redesigned so the output is now 2(1-e^(-t/tau)), plot their outputs.


Once again, a few changes to the original script make easy work of this assignment.

Assignment 2:

A)
Find the numerical and analytical solution to the addition of the following two sinusoids:
3sin(2t+10degrees) 
5cos(2t-30degrees)

Analytical solution 7.3sin(2t+41.66degrees)

plot of numerical and analytical solutions in freemat, NOTE: the accuracy of the analytical solution was so close to the numerical that it was impossible to distinguish the two sinusoids from each other. This plot shows one with a vertical offset of .3 units in order to prove that both solutions are being graphed.


Assignment 3:
A) Let A1 = 3+2j, A2 = -1+4j, B = 2-2j. Find (A1*B)/A2 by hand, and then using freemat.

Here is the proof of solving it by hand:

And here is the result in Freemat:


The answers are sufficiently similar.

B)
Develop a sketch in freemat which can convert from rectangular to polar and from polar to rectangular.

try example 1 and show the results in 2 forms.


C)
Redo part A and B for the equation D = (A1+B) * A2

AC signals #1

Analysis of AC circuits can be accomplished using differential equations or by transforming the circuit into the phasor domain. If you are unfamiliar with the phasor domain, look at the following links: wikipedia , a nice powerpoint.

Ok, now that you are completely confused, I can explain phasors in a sentence. All phasors contain a magnitude and a reference angle to some established signal.
That is all well and good, but how do we use them in MATHS? In real analysis there is no unique solution to vector division, and if we need to divide a voltage vector by a resistance vector, we are stuck. Luckily, Complex analysis (inclusion of sqrt(-1) in our terms as i or j) allows for complex division, and now we proceed to apply Ohm's Law to our hearts content.

Now for applications, take for instance the two sinusoids found below.


The blue curve has an RMS voltage of .707 V, whereas the green curve has an RMS voltage of .530 V. There is also some appreciable difference in their phase, as the green peaks consistently lag behind the blue peaks. If we wanted to quantify the difference in their phase we could measure their period, (about 63 units here) and the horizontal distance between two points of interest, such as their peaks or when they cross the x-axis. By inspection, their peak values appear to be off by 13 units. It is now possible to measure the phase difference between these two waveforms. In the unit of degrees, the phase difference can be defined as:


Which in this case indicates that our green waveform lags the blue waveform by 74.3 degrees.

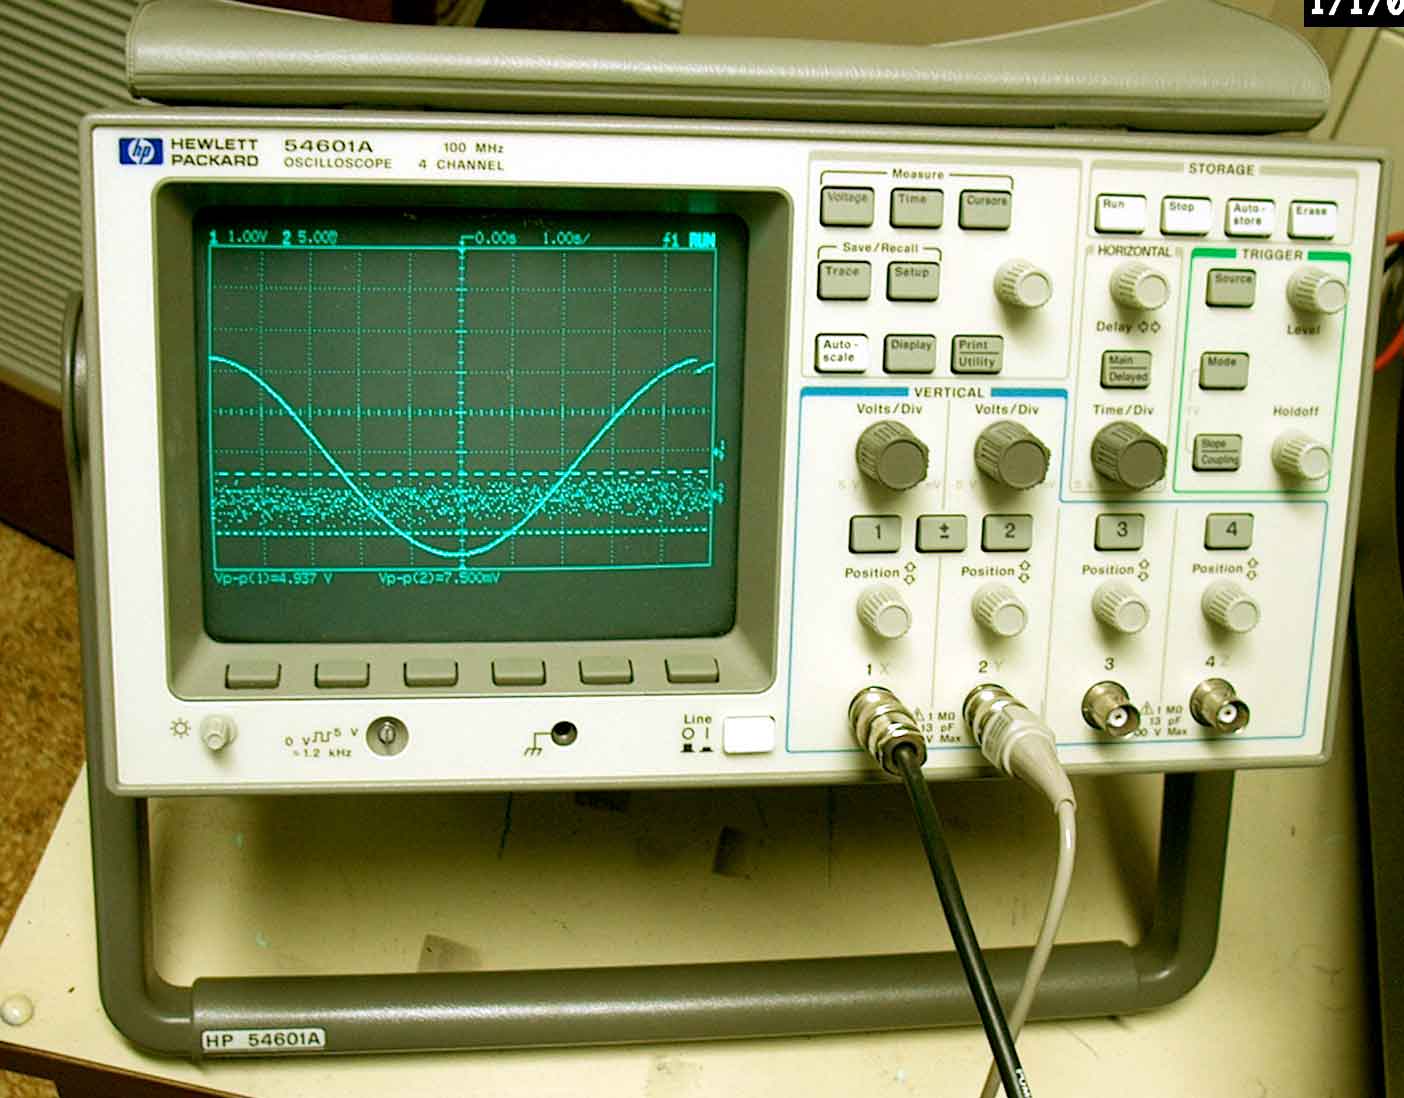
These measurements can also be performed on an oscilloscope (o-scope), which is a device used to measure voltage as a function of time. Any student with a background in mathematics has spent a good amount of time looking at graphs, and those skills are easily applicable to use of an o-scope.

Most of the time an o-scope looks like this:

[picture credit to http://www.caraudio.com/forums]

The o-scope pictured is a digital storage o-scope, and it has the benefit of being able to store transient signals on the display for analysis. Another type of o-scope is the analog scope, which has its own benefits. A more detailed discussion of scopes and their characteristics can be found here.

The focus of this lab will be to familiarize students with the operation of an o-scope and to analyze a simple AC circuit.


Equipment:
Function Generator
O-scope
Scope Probes
Variable Resistance Box
Capacitor (100 nF)

Step 1:
Set the function generator to output a waveform with 10 V peak-peak at 1kHz.
What is the RMS value of this waveform?

3.356 V

Step 2:
 Measure the Voltage of the function generator using a Digital Multimeter.

What is the measurement?

3.3 V
Is it the same as your answer from step 1?

no, the voltage recorded by the digital multimeter is likely in error. The meter chosen is a standard cheap toolbox model and probably does not handle high frequency measurements very well.

Step 3:
Calculate the impedance of the 100nF capacitor at 1kHz? (show equation)


Step 4:
Assemble the following circuit and connect the o-scope probe such that it measures the voltage across the capacitor.


Special consideration must be used when measuring components using an o-scope. Many scopes have what is called a 'common ground' meaning the alligator clips attached to them are all connected to each other and the earth ground. If you connect a ground in the wrong place in your circuit you can short components out of the circuit, and furthermore you can damage your probes and scope. That being said, always connect your scope probes to the same node as the ground for your function generator in order to take proper measurements.

Step 5:

Measure the voltage across the capacitor.

8.2 V peak-peak

Step 6:
record the voltage using the DMM, do the results match?

2.78V

the predicted RMS voltage, based on the peak to peak value is 2.90 V, so it is close.

Step 7:
Set up channel 1 of the o-scope to measure the function generator and have channel 2 measure the capacitor voltage. Now measure the phase difference between the two.

approx: 30.19 degrees

Step 8:
Which signal leads and which lags?

Ch1 is leading, thus the capacitor voltage lags the source voltage.

Step 9:
Sketch the display and indicate how your determined the phase difference.


Step 10:
Increase the function generator frequency to 10kHz:
Measure the peak-peak voltage on the capacitor at the new frequency.

1.68V

Step 11:
Record the RMS voltage according to the DMM

429mV

step 12:
Find the phase difference between the source signal and the capacitor voltage.

79.776 degrees


Step 13:
Now try switching the resistance box to 10kOhms and observe the difference:

Vcap = 1.69V
Vcap,rms = .518
phase difference = 77.839 degrees

Step 14:
now toggle the resistance box until the capacitor voltage is 4V peak-peak.
R = 4kOhms
Vcap,rms = 1.223
phase difference = 66.16 degrees

Analysis:
Sweep the function generator across the range of available frequencies, record your observations.

The voltage across the capacitor is higher when the frequency is low, and lower when the frequency is high. This correlates with what is described as a lowpass filter. Adjusting the frequency lower makes the phase difference between the two signals approach 0 degrees, and adjusting it higher makes the phase difference approach 90 degrees.

Wednesday, May 30, 2012

Capacitor Charging/Discharging

Design problem:
Some devices require rapid application of power in short bursts. Providing this energy from a source like a motor or a battery is impractical because it must have high capacity but be used infrequently. A capacitor can store electrical energy, and release it rapidly, which makes it ideal for this application.


In the figure above, the switch initially connects C1 to V1 and R1, in this state the capacitor will begin to charge. The voltage on the capacitor grows as a function of (1-e^(-kt)) similar to the following free mat plot.


When the switch is moved to the second position, the voltage across C1 will begin to bleed through R2. The voltage during discharge will resemble a exponential decay plot, like the following graph.


The rate of increase and decrease are limited by resistors R1 and R2 respectively. If we would like to slowly charge the capacitors with a low power source we can make R1 large and if we would like to discharge the capacitor quickly we can make R2 very small.

Lab Problem:

Design build and test a charge/discharge system that uses a 9V power supply, has a charging interval of about 20s with a stored energy of 2.5mJ and can discharge is 2s.

1. Determine Capacitance

The capacitance can be found by solving for the energy stored on a capacitor, which is one half the capacitance multiplied by the square of the voltage. This corresponds to a capacitance of 61.7uF (ideal) or 64.5uF (real). (the difference between the real and ideal is the concept of leakage current through the dielectric material used to insulate the capacitive elements from each other.)

2. Determine R1

The charging time is approximately 5tau, where tau is the time constant for the RC circuit. In RC circuits, tau is equal to the product of R and C. In order to solve for the resistance, one would take the capacitance found in step one and multiply it with the unknown R1 and then multiply by 5.  This expression is then equated to 20s and solved for the unknown.

3. Determine R2

As the discharge time is one tenth the charge time, the capacitor is shared in each instance, and the resistance is proportional to the time constant, one can just assume R2 = R1/10, yielding a value of 6.48kOhms.

Analysis of Circuit Measurements:

1. What could account for the difference between the supply voltage and the maximum capacitor voltage recorded?
 Every capacitor has some leak resistance, which means that the maximum voltage seen across its terminals is controlled by the voltage divider formed by the input resistance and the leak resistor.
In out experiment the max voltage was found to differ from the supply voltage by approximately 6 percent. This corresponds to a leak resistance of 872 kOhms.

A cursory examination of this result would allow the engineer to record that data point and then move on, however there is a variable which needs to be accounted for. The typical input resistance of a scope probe is 1 MOhms, and as we were recording our voltage measurements on a scope the calculated resistance may be greatly in error.

Once compensated, the leak resistance is found to be approximately 6.8 Mohms.

2. Does the capacitor fully discharge within 2 seconds?

Yes, the discharge time is approximately 2 seconds.

3. Calculate the Thevinin Voltage 'seen' by the capacitor during charging.

Trivial. In the steady state condition a capacitor has the Thevinin voltage across its input terminals, so the Vth is the measured value. If the scope resistance was not interfering, the terminal voltage would be less than 1 percent different than the source voltage.

The measured voltage was found to be 8.45 volts.

4. Calculate Vth and Rth 'seen' during discharge.

Using the cursory solution, Rth is found to be 6432 Ohms, a .7 percent variance from the ideal circuit. Using the compensated solution the resistance is found to be 6473 ohms,  a .1 percent variance.

Vth is zero in the discharging state as there is no source in the circuit.

5. Determine the time constant for your circuit by measuring how long it takes to reach  99 percent of Vth.
 Charge time:
Actual 22.1 seconds
Theoretical 20 seconds.

Time constant:
Actual 4.42 seconds
Theoretical 4 seconds


Practical questions:

 If this system was used to power a rail gun, 160MJ per discharge, and is charged at 15kVDC find:
1. Capacitance

(1.42F)

2.If the capacitance was provided by 8 capacitors arranged such that 2 are in series in four parallel branches, what should the individual capacitance ratings be?

(.711F)