Install LaTeX?

Tuesday, March 27, 2012

Pspice Simulation


Pspice is an electronic circuit analysis tool, and can be used to find Thevinin and Norton equivalent circuits.
We are going to analyze the following circuit...


A simple way to analyze this circuit is to place a DC current source between terminals A and B and sweep the current from 0 to 1 amps.

If you do this, the following graph will result:
Note that when the current is zero, the voltage is 10 V. This is equal to the Thevinin Voltage for the circuit. The slope of the graph is the Thevinin Resistance. Based on this information, the equivalent Norton and Thevinin Circuits can be constructed as a 3 amp current source in parallel with a 3.33 Ohm resistor, or a 10 volt source in series with a 3.33 Ohm resistor.

If an 8 ohm resistor is connected across terminals a and b, the following schematic results.
 Important to note is the voltage across and the current through the resistor R9.

If the equivalent Thevinin and Norton Circuits are constructed, the following schematic results.

The voltage and current though each of the load resistors is equal to the results from the real schematic, providing further evidence for the theorems of Norton and Thevinin.

If we want to find the ideal resistance to connect across the load, we can use a global parameter sweep on a variable resistor to graph power as a function of load resistance.

To do so, a resistor is connected across terminals a and b, and its resistance is declared as a global parameter. Then we run a DC analysis sweeping its resistance from 1-10 in a step size of .1 ohms. If we sweep from 0, we may encounter an error, so it is advisable to start from a non-zero resistance, which you are sure is less than your ideal resistance.

A graph of the current and voltage through the load as a function of resistance takes the following form.


If the product of those two functions is also plotted, the following graph results.

From this graph, it is evident that the maximum power is approximately 7.5 Watts, and this power corresponds to a resistance of about 3.33 ohms. This resistance is identical to the Thevinin resistance, and thus lends credence to the maximum power transfer theorem.

Monday, March 19, 2012

Introduction to Freemat

Freemat is an open source math computing environment with its own programming language, which is very similar to Matlab. Though Matlab has much more robust documentation and access to toolboxes with special programs and features, freemat is a good solution for simple matrix operations and simple plotting functions.

Why use freemat instead of c++?

well, lets take a look at the c-code necessary to plot a sine wave.

Take a look at this code by vegaseat.

The program is fairly elegant and condensed into about 30 functional lines.

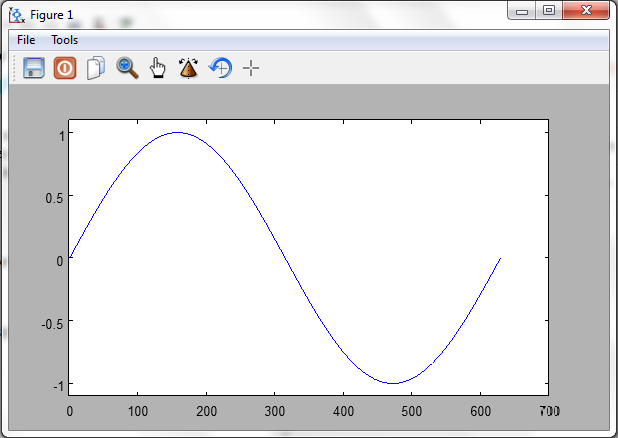
To do the same thing in freemat the syntax is as follows.

x = 0:.01:6.28;
y = sin(x);
plot(y);

the result of these three lines of code looks like this:

 In addition to being quicker and more intuitive than the C-code version, freemat comes with plot editor tools which can be used to add titles, keys, and other graph information. This makes it ideal for generating plots which can be used in presentations, posters or research papers.


Why are we discussing a numerical simulation environment in a course on Electronics? Well if you read any of the previous posts on introduction to transistors or introduction to nodal analysis, it is clear that systems of equations arise frequently in electric circuits. For instance the following circuit has unknown voltages in between R1 and R2, also between R2 and R3.


Using Nodal analysis and a naming convention for the voltage between R1 and R2 as V3 and the voltage between R2 and R3 as V4, the equations for those unknown nodes can be written as:

(V3-V1)/100+V3/1000+(V3-V4)/220 = 0
(V4-V3) /220+V4/1000+(V4-V2)/220 = 0
As V1 and V2 are known to be 12V and 9V respectively, the equation can be simplified to:
(0.015545)V3-(0.004545)V4=.12
(-0.004545)V3+(.010091)V4=.04091

This is a system of 2 equations with 2 unknowns, and can be solved by hand, or it can be solved by freemat.

If you have taken a class on matricies, you may remember the inverse matrix operation. Which can be used to solve problems of the form:

Ax=b

If the inverse of A is premultiplied by both sides, the answer x is easily found. To do this in freemat the following commands should be entered.

A = [0.015545 -0.004545; -0.004545 .010091]
b = [.12;.04091]
x = inv(A)*b;

the answer should look like :
x =
   10.2553
    8.6731  
Which is nearly identical to the output from the simulation model (pictured below)


Challenge: If given the circuit below, can you use freemat to determine the current through R3?

This is a good time to use mesh analysis, with the first mesh applying to components V1->R3->R1.
The second mesh applying to components V2->R2->R3.
The matrix for this circuit can be written:
A =
  30 -10
 -10  15
 b =
 15
  7

inv(A)*b = 
    0.8429
    1.0286

meaning that the mesh current through mesh 1 is .8429A clockwise, and mesh 2 is 1.0286 clockwise, meaning the current through R3 = .8429-1.0286 = -.1857A, the negative sign indicating that the current is directed up.

If the spice model is run, the following image results.

It is clear that matrix multiplication is an effective way to solve systems of equations, and the simplicity of using freemat makes it a viable circuit analysis tool.

Transistor Analysis

In this experiment we are asked to determine the gain of an npn transistor of type 2N3904 using the following circuit configuration.

In order to find the gain for this transistor, we need to understand a little more about how a transistor works. For more information on the inner workings of a transistor see this link. Now that we know what a transistor is, we are interested in analyzing it in our circuits. A transistor can be modeled as a current dependent current source, an independent voltage source, and a dependent voltage source.

Here is a picture of the equivalent circuit.:
Important to note about this image, the voltage across V5 is usually .7V while the transistor is in its active mode. The dependent current source I1, and the dependent voltage source V6 are undetermined until the current through R6 is determined. At that point the current through R6 can be multiplied by the gain, and the current through I1 is the result. Both currents sum together and travel through V6 to ground. The hard cap on the current through I1 is partially determined by the transistor, and also by V3 and R7. By inspection, it is easy to note that the current through R7 can never exceed 60 mA, because in order to do so each element after it would have to have negative resistance. (the maximum voltage is 6V, divide by 100 to get 60 mA)

In order to determine the gain of the transistor in question, we will want to test currents well below 60mA in order to preserve the linear relationship between input current and output current. In the original configuration, the simulation predicts a base current of 162.11 uA and a collector current of 25.37 mA. This corresponds to a gain of approximately 150, and the current through our limiting resistor is not nearly reaching the theoretical maximum. The next step is to take some data to verify if this circuit element has similar properties to the element we have in the lab.


Using a variable resistor box, 2 Digital Multi-Meters and a 2n3904 transistor we took several data points for base current and collector current, the results can be found in the table which follows, and pictures of the setup are shown below.

 Pictured above: the experimental setup, including the all important coffee cup.
 The above tangle of wires sends current to the transistor, away to the meters, and does not look anything like the nice schematic from earlier.

It is evident from the data collected that the gain is converging to some real number, and this is more evident from a plot of the collector current versus base current.


The graph has a decidedly linear appearance, and a non zero intercept.

Due to the limitations of the input resistor, the circuit configuration will saturate at about 247uA or nearly 2.5 times the maximum input current in our data. Although the transistor may exhibit highly non-linear behavior as the base current approaches this value.

According to the graph, the transistor we used had a gain of approximately 250, meaning that the spice model from earlier used a transistor with a different gain. If we are going to simulate any circuits using this transistor, we will either need to find the appropriate model in the libraries, or make a new model based on the existing part but with a higher gain.

Nodal Analysis


Nodal Analysis is a method to calculate unknown parameters in a circuit design. It relies heavily on Kirchoff's Current Law, which say that the sum of the currents entering any node is equal to the sum of the currents exiting that same node.

In this experiment we are asked to analyze the following circuit:

Some information that we might like to have is the voltage between R1 and R2 (Which we will call V3), and the Voltage between R2 and R3 (V4). 
 
The appropriate method to determine these unknown voltages is to write KCL equations at each node, and then solve the resulting system of equations. If the bottom rail is assigned the value of 0V or Ground, the expression governing the node between R1 and R2 is:
 
(V3-V1)/100+V3/1000+(V3-V4)/220 = 0
 
for the second node the equation is:
 
(V4-V3) /220+V4/1000+(V4-V2)/220 = 0

At this point it may concern you that all of the currents are directed out of each node, but the voltages will take care of the direction of the current. For instance, the term (V4-V2)/220 if V4 is greater than V2 then the current will flow from left to right, or out of the node. If V2 is greater than V4 the current will be negative, indicating the opposite direction.

At this point you can solve for the node voltages by noting that V1 is 12 V and that V2 = 9V. Alternately, you could run this simulation in pSpice and arrive at the following values.


Using these results it is possible to calculate the current through each branch. The result should look something like this.


Based on this analysis, the 12V power supply is delivering 17.45 mA of current, and the 9V power supply is delivering 1.484 mA of current.

The power from V1 is (12V*.01745A) = .2094 W
Power from V2 is (9V *.001484A) = .01336 W

Now that the analysis is complete, it is time to build the circuit. In place of the two voltage supplies we are using 2 lab volt unregulated power supplies. Both are capable of providing the voltage and current necessary for the experiment.

Below is a picture of the circuit constructed on a bread board. Note that the orientation is upside down in reference to the earlier schematic.


Using this circuit, we took measurements of voltage and current to compare with the simulation.

The results are summarized in the following table:
The largest error can be found in the current from the second supply, however a small error in the output voltage of the 12V supply can be magnified significantly in the 9V supply, as its total current is an order of magnitude smaller.

The actual power delivered by each of the power supplies was found to be:

P1 = .2244 W
P2 = .01197 W

P1 error = 7.1%
P2 error = -10.4%

In the second step of the experiment we are asked to determine the  necessary power supply voltage such that V3=V4=9V.

Below is a diagram which describes the necessary source voltages to achieve this:
We constructed this circuit and then measured the actual voltages at each node, in addition to the currents leaving each voltage source.

I1 = 8.4mA
I2 = 9.5mA
V3 = 8.89V
V4 = 8.98V

The difference between the measured values and the calculated values can be mostly attributed to the non-ideal resistance of the resistors in the circuit, in addition to additional circuit loads such as the resistance of connecting cables, and the resistance of the ammeter when it was connected.


Sunday, March 18, 2012

Introduction to Biasing

This experiment is designed to introduce the concept of Biasing. Biasing in this context is the selection of appropriate circuit elements in order to create a desired voltage at a specific point in the circuit. In the case of the two LEDs pictured, each is rated to operate optimally at a different voltage. The green one is designed to operate at 2 Volts and the yellow one is designed to operate at 12 Volts. If we try to power both LEDs in parallel, as shown in the picture, appropriate resistors need to be chosen to bias the LED's input voltage.

The experiment originally called for the yellow LED to be of the 5 V type, so the results may be different than originally predicted.

In order to properly Bias the circuit, it is important to know how much current is dropped across the LED when it is operating properly. From now on, the Yellow LED will be referred to as LED 1 and the green will be LED 2. LED one is rated for 22.75 mA at 5V and LED 2 is rated for 20.00 mA at 2 Volts. Based on this information, it is determined that each LED has an effective internal resistance of 424, and 100 Ohms respectively. Based on this data, 2 resistor values were chosen to drop 4 volts and 7 volts from a 9 volt power supply. The result can be found in the schematic seen above.

A keen eye will notice that the current through the left branch cannot possibly be near the 22.75 milliamps requested in the ratings, and this is due to LED 1 not being of the proper type. However, the node voltage between LED 1 and Resistor 1 is still 5 Volts as desired.

The Current in the left branch is 10.7 mA and the right branch has current of 20.00 mA. The resistors are disipating .043 and .14 Watts respectively. Both of these values are less than the maximum power rating for the chosen resistors so our circuit is safe for construction.

Once the circuit has been constructed, it is desirable to see if our calculations actually created the desired bias voltage.
A multimeter was used to determine the current and voltage for each LED in three configurations. The first with both LEDs in the circuit, the second with only LED 1 connected and the third configuration with only LED 2 connected.The results can be found in the following table.


It is evident in the data that biasing is independent of the load as long as the power supply is operating at much lower than its maximum range (which for the chosen supply was 2 Amps).

Questions:
How long could your circuit operate if running off of a 9-Volt battery if the supply voltage begins to drop at .2A-hr?

.2A-hr/.0292A = 6.6 hours

What is the percent error between the achieved LED current and the desired current?

The green LED has a percent error of -4% but the yellow LED has percent error of -56%. This large error is due to the yellow LED not conforming to the specifications outlined in the laboratory report. They were in fact rated for 12 Volts instead of 5 Volts.

From your Data determine the circuit efficiency.

Power out = Pled1 +Pled2 = 10mA*5.64V + 19.2mA*2.18V = .0982 W
Power in = 29.2 mA * 9.09 V = .2654 W

efficiency = Pout/Pin = .0982/.2654 = 37%

If the battery voltage was changed to 6 Volts how would the efficiency change? What is the ideal voltage to achieve maximum efficiency?

If the voltage was lowered to 6 volts the efficiency would go up because smaller resistors could be used to bias. Thus less power would be wasted into heat.

The ideal configuration, as far as efficiency is concerned, would be to connect a 30 Ohm resistor, LED 1 and LED 2 in series. Drive the entire circuit at 7 Volts.

Power out = 20mA*4.4 V + 20mA*2V= .088 + 04 = .128 W
Power in = 20 mA * 7 V = .14 W

Efficiency = 88.57%

A higher theoretical efficiency is possible, however it requires a higher current in series, which would overdrive the green LED and possibly damage the circuit.

Monday, March 5, 2012

Introduction to DC circuits


Design Problem: A piece of electronic equipment is to operate at a considerable distance from its power source. The power will be transferred through a length of cable, with a maximum length to be determined.

Load is rated to consume .144 watts at 12 volts.
Load will continue to operate as long as the voltage does not drop below 11 volts.
The battery supplying the load has a charge of .8Ahr.

Question:
Determine...
Maximum possible cable resistance
maximum length of cable is using 30 AWG cable
distribution efficiency
approximate time before the battery discharges
The circuit in question can be represented as a battery, attached two a load with two resistors. Like so.
 It is easier to analyze this circuit if we combine like elements in series. Thus cable one and two can be represented as a single resistor.
In order to model this circuit, we used a power supply and a decade resistor box, seen below.


Based on the initial conditions, the load will be represented by a 1kOhm resistor. The banana cables, ammeter and resistor box had internal resistance of 1.8 Ohms, so this total was added to the final measurement. The power supply had a maximum voltage rating of 12 Volts and a maximum current rating of 2 Amps. 

As the power supply is non-ideal, we measured its output voltage and it was found to be 12.11 V. 
The decade resistor box was switched to read 84 Ohms, and the voltage across the supply was found to be 11.04 Volts. The true value of our 'load' resistor was found to be 975 Ohms. In this configuration, the ammeter read 18.37 milliamps. Based on this data, we determined that it should take 40.8 Hours for the battery to discharge. (In reality the battery would lose voltage as the charge was transferred, so these results are merely theoretical.)

Surprisingly,  these readings indicate that the load is consuming .201 watts, which is greater than its consumption at 12 Volts. However, this calculation neglects the current leeched by the parallel Volt meter. An ideal resistor of 975 Ohms dissipates .125 Watts at 11.04 Volts. Thus the Volt meter must be responsible for .076 watts of the calculated value. Additionally, 12.11 Volts and 18.36 mA corresponds to a functional resistance of 653 Ohms for the entire circuit.  Working backward, this indicates that the shunt resistance in the volt meter is approximately 1350 Ohms. This resistance is comparable to the resistance of our load, and thus including the voltmeter in the circuit skews the results.
 
According to Ohm's law, a 975Ohm resistor should pull .1128 A and this corresponds to a cable resistance of 98.4 Ohms. The inclusion of the Voltmeter changed the results of the experiment by 12.8 percent.

Using the theoretical results, the efficiency is 90.7%, and the length of cable equal to 142.56 meters.

Optional questions)

e)Communication through the cable is Transistor Transistor Logic, and this requires a  0-.4 Volt logic low and a 2.6-5.0 Volt logic high. If the load device requires 20 mA to operate and the signals are 5 volts at the input, how long can the cable be before the signal will be unable to trigger TTL at the other end? Additionally, the communication wire is approximately 28 awg.


Using the same schematic from earlier, the load is 20 mA at 5 Volts, which corresponds to a load resistance of 250 Ohms. Again, the cable is reduced to a single resistance element. If the current remains at 20 mA, and the load can function down to 2.6 V then the voltage drop in the cable can be as high as 2.4 volts. This corresponds to a resistance of 120 Ohms. Using the table for resistance as a function of wire gauge:

(more info can be found here http://hyperphysics.phy-astr.gsu.edu/hbase/tables/wirega.htm)

and a resistance multiplier for the step from 24 awg to 28 awg of 2.53, we find that the resistance of 28 awg is 213.7 mOhms per meter. This corresponds to a maximum cable length of 280 meters before TTL communication can no longer be transferred.

f) Using the same configuration, an electric ROV (remote operated vehicle) can get enough power to run its motors. Assuming that the ROV needs 10 A at a minimum of 36 V in order to operate, what is the maximum cable gauge that can be used with a 48V power supply and a 60 foot cable?

Repeating the calculations from the previous problem it is determined that the resistance per foot needs to be on the order of .001 Ohms. This corresponds to approximately 10AWG cable.